Building an MLOps Monitoring Dashboard for NVIDIA Triton Server.
How to monitor GPU, latency, throughput and other advanced Triton Server metrics using Prometheus and Grafana.
In this article, you will learn:
How to build an advanced Grafana dashboard for Inference GPU
How to set up Prometheus time-series metrics server
How to monitor a Triton Server deployment
Key GPU metrics
Compared to classical ML inference pipelines, deep learning systems require more “critical” and verbose monitoring.
Post-deployment monitoring is a foundation pillar of MLOps.
In this article, we’ll build a monitoring service from scratch for an NVIDIA Triton Server deployment, using Prometheus for metrics streaming & Grafana for the dashboard.
For the Triton Server part, we’ll use the model repository we’ve created in this series: 👉 YOLO11 with Triton.
But, you could still follow this article without the Triton Part.
Table of Contents:
Tools Overview
Configuring Prometheus
Configuring Grafana
Preparing Folder Structure
Docker Compose
Testing
Takeaways
Tools Overview
Prometheus is an open-source systems monitoring and alerting toolkit originally built at SoundCloud.
Prometheus collects and stores its metrics as time series data, i.e. metrics information is stored with the timestamp at which it was recorded, alongside optional key-value pairs called labels.
Grafana is an open-source visualization platform, that allows you to query, visualize, alert, and explore your metrics, logs, and traces wherever they are stored. It integrates seamlessly with multiple data sources, including Prometheus, transforming time-series database (TSDB) data into graphs and visualizations.
Preparing Folder Structure
We will create the following folder structure, that will allow us to keep the project clean and easy to reference in our docker-compose deployment.
| monitoring
| |- datasources/
| |  | - prometheus.yaml
| |  | - scraping.yaml
| |- dashboards/
| |  | - dashboards.yaml
| |  | - perf_triton_dashboard.json
| |- docker-compose.monitoring.yaml
In datasources we’ll keep the configs related to Prometheus configurations.
In dashboards we’ll keep the configs related to Grafana
Configuring Prometheus
To get started, in datasources/scraping.yaml config file we’ll specify which services should Prometheus query and scrape metrics from, given this blueprint:
global:
  scrape_interval: <seconds>
  evaluation_interval: <seconds>

scrape_configs:
  - job_name: '<service_name>'
    static_configs:
      - targets: ['<host>:<port>']
Now, let’s configure this with the actual services:
global:
  scrape_interval: 15s
  evaluation_interval: 15s

scrape_configs:
  - job_name: 'prometheus'
    static_configs:
      - targets: ['prometheus:9090']
  - job_name: 'triton_server'
    static_configs:
      - targets: ['triton_server:8002']
Each 15 sec, we will fetch a new set of time-stamped metrics from both of these services. We also added “self-scraping” such that we’ll have health metrics for the Prometheus service itself.
To note here, that under -targets we use <container_name>:<port>, and when defining our docker-compose.yaml file we’ll name the services with <container_name>.
Now that we’ve specified targets, let’s add Prometheus as a default data source in Grafana.
Configuring Grafana
To add a data source, we’ll complete the datasources/prometheus.yaml to specify the Prometheus service endpoint for Grafana.
apiVersion: 1

datasources:
  - name: Prometheus
    type: prometheus
    access: proxy
    url: http://prometheus:9090
    isDefault: true
    editable: true
Dashboards in Grafana can be configured in 2 ways:
Manually - directly from the Grafana Visualizer, which is time-consuming and repetitive.
FromFiles - dashboards can be saved as .json or .yaml on disk, and loaded automatically when we deploy the Grafana service.
We’ll use the second method, and for that, we fill the “dashboards/dashboards.yaml” specifying from where to load the configurations.
apiVersion: 1

providers:
- name: 'Prometheus'
  orgId: 1
  folder: ''
  type: 'file'
  disableDeletion: false
  updateIntervalSeconds: 10
  options:
    path: /etc/grafana/provisioning/dashboards
When starting the containers, we’ll mount the local path to the in-container /etc/grafana/provisioning/dashboards path, so they can be loaded automatically.
Next, copy the perf_triton_dashboard.json from this Github Gist and place it under dashboards/perf_triton_dashboard.json.
Further, let’s define our docker-compose deployment in docker-compose.monitoring.yaml.
Docker Compose
In our docker-compose file, we will have 3 services, prometheus, triton_server, and grafana. Let’s unpack them:
Prometheus
services:
  prometheus:
    image: prom/prometheus:latest
    ports:
      - "9090:9090"
    container_name: prometheus
    restart: always
    volumes:
      - "./datasources:/etc/prometheus/provisioning/datasources"
      - /var/run/docker.sock:/var/run/docker.sock:ro
    command:
      - "--config.file=/etc/prometheus/provisioning/datasources/scraping.yaml"
      - "--enable-feature=expand-external-labels"
    networks:
      - monitoring-network
We mount the `.datasources/` to the prometheus container and specify the config.file under command to point to the scraping.yaml file we’ve already created. Port 9090 is the default.
Grafana
grafana:
    image: grafana/grafana-enterprise:8.2.0
    container_name: grafana
    ports:
      - "3000:3000"
    volumes:
      - "./datasources:/etc/grafana/provisioning/datasources"
      - "./dashboards:/etc/grafana/provisioning/dashboards"
    environment:
      - GF_PATHS_PROVISIONING=/etc/grafana/provisioning
      - GF_AUTH_ANONYMOUS_ENABLED=true
      - GF_AUTH_ANONYMOUS_ORG_ROLE=Admin
    networks:
      - monitoring-network
We mount both `./datasources` and `./dashboards` local folders to the grafana container such that it can load the existing data source (prometheus) and dashboards (perf_triton_dashboard.json). Port 3000 is the default.
Triton Server
triton_server:
    container_name: triton-inference-server-23.10
    image: nvcr.io/nvidia/tritonserver:23.10-py3
    privileged: true
    ports:
      - "8001:8001"
      - "8002:8002"
    deploy:
      resources:
        reservations:
          devices:
            - driver: nvidia
              capabilities: [gpu]
    volumes:
      - ./model_repository:/models
    command: ["tritonserver", "--model-repository=/models"]

    networks:
      - monitoring-network
Following the Deploying YOLO11 with Triton series, you will have a `.model_repository/` folder with the TensorRT model to be deployed with Triton, that we’ll mount to `/models` inside the container.
We’ll also specify the resources to allow access to the system’s GPU, required to run Triton. Port 8001 and 8002 are the default, 8002 being the metrics port from inside the Triton container.
For every service in our compose file, we have a networks argument, where we specify that each service will run on the same network and can communicate with each other.
To create a network, simply run: docker network create monitoring-network.
Testing
Let’s deploy our docker-compose stack, and inspect if each service started as expected.
docker compose -f docker-compose.monitoring.yaml up -dWe use the -d flag to run it in detached mode, such that our terminal would not be blocked waiting for the services.
Now, let’s inspect each service one by one.
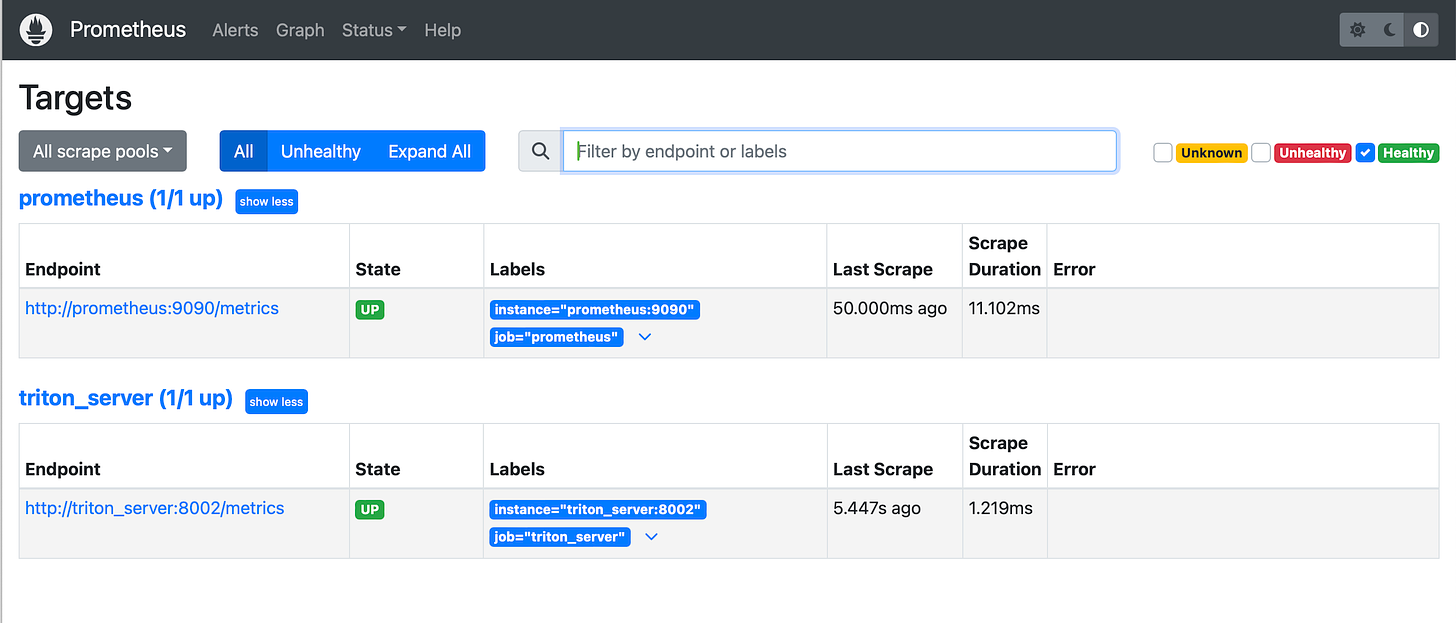
To make sure Prometheus is healthy, we will open localhost:9090/targets.
Next, let’s check that the Triton Server streams metrics as expected on port 8002.
curl http://localhost:8002/metricsWe should get an output similar to the following:
# HELP nv_inference_request_success Number of successful inference requests, all batch sizes
# TYPE nv_inference_request_success counter
nv_inference_request_success{model="yolov11-engine",version="1"} 0
# HELP nv_inference_request_failure Number of failed inference requests, all batch sizes
# TYPE nv_inference_request_failure counter
nv_inference_request_failure{model="yolov11-engine",version="1"} 0
# HELP nv_inference_count Number of inferences performed (does not include cached requests)
# TYPE nv_inference_count counter
nv_inference_count{model="yolov11-engine",version="1"} 0
# HELP nv_inference_exec_count Number of model executions performed (does not include cached requests)
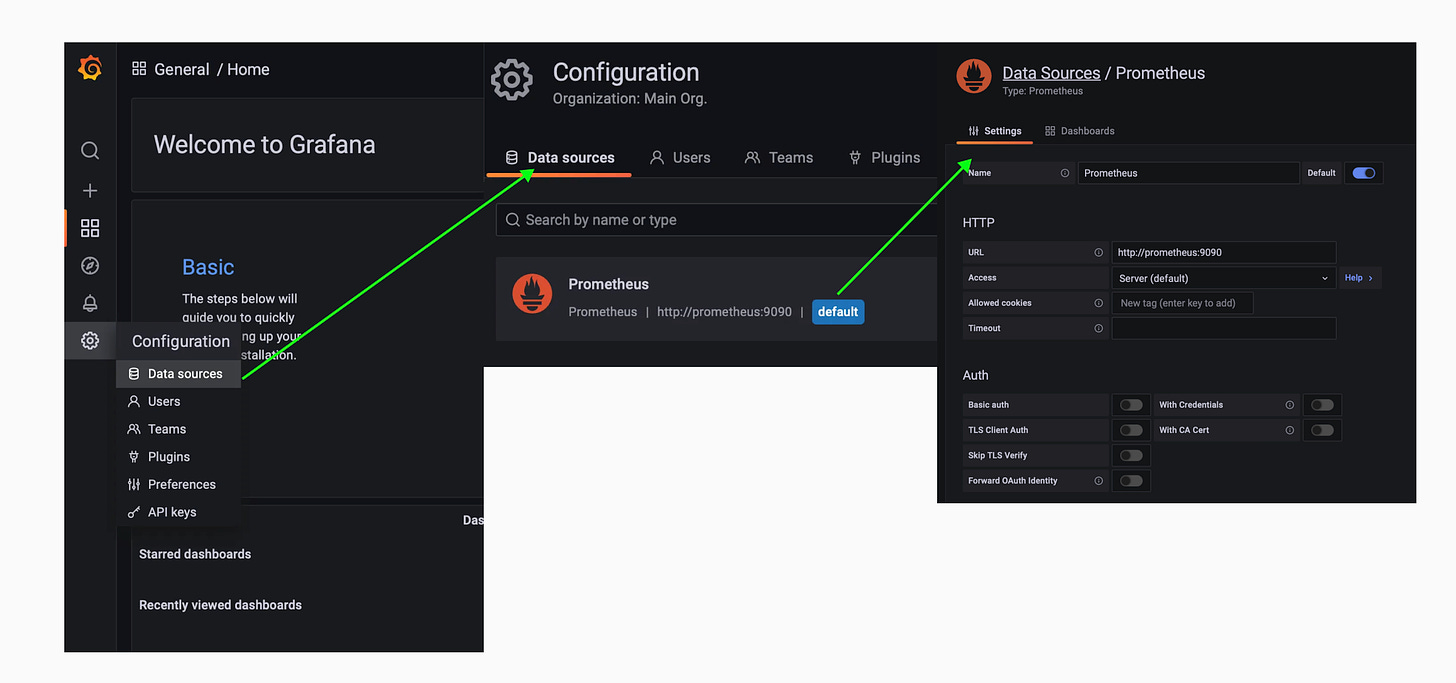
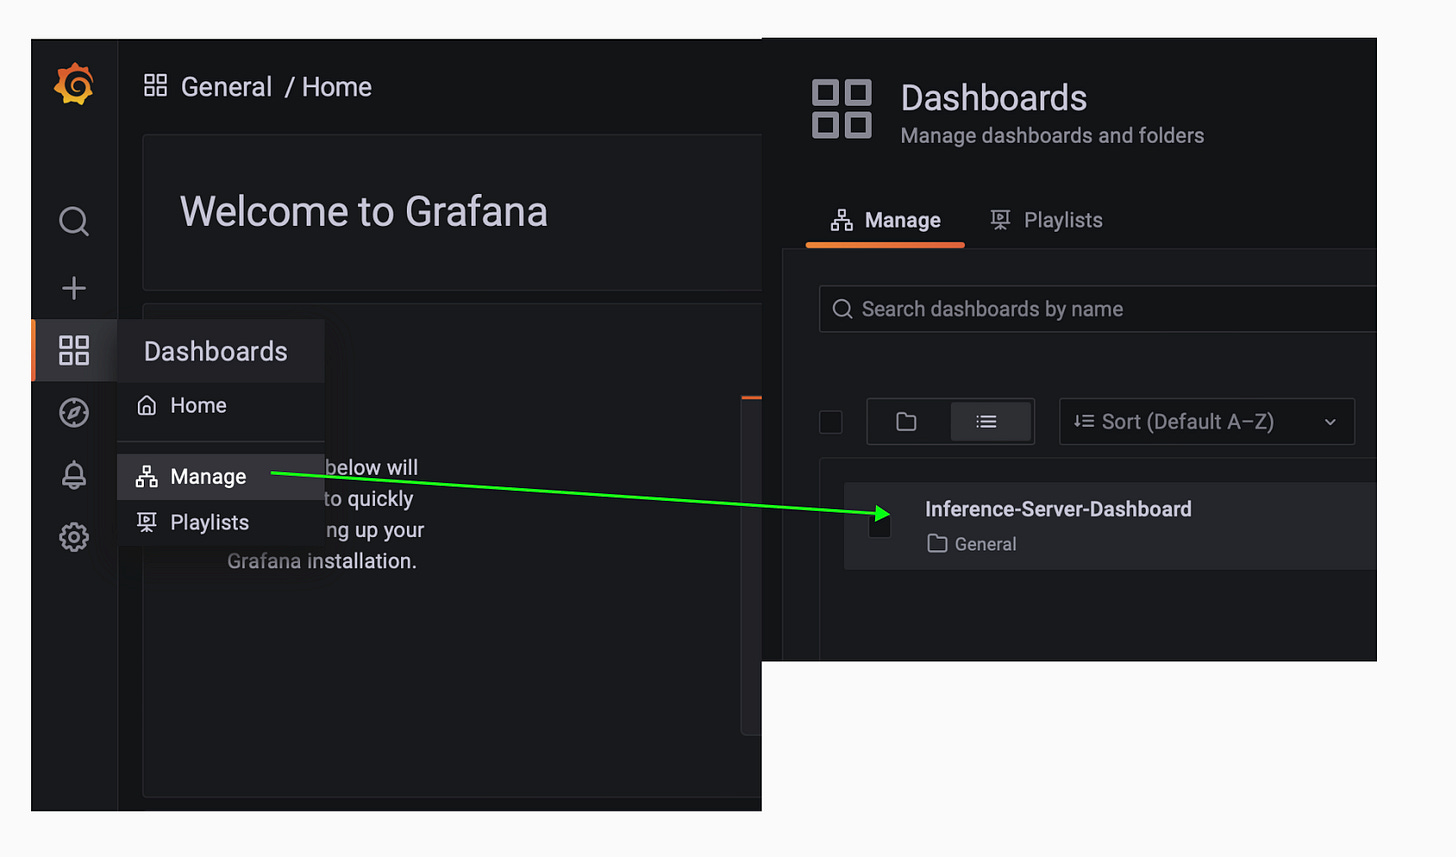
Lastly, let’s see if Grafana loaded correctly our dashboard and Prometheus data source. For that, we’ll go to localhost:3000, log-in with default admin/admin credentials (as we haven’t specified any custom auth).
Let’s check if our data source is loaded correctly
Let’s check the dashboard is loaded correctly
Inspect the dashboard
Here are a few metrics we are capturing:
Input time/req - time it took the client to send input payload to Triton server.
Output time/req - time it took the Server to send output back to client.
DB ratio - ratio between successful requests over all requests
Queue time/request - how long does a request is queued before processed.
GPU Bytes Used — percentage of VRAM used.
GPU Utilization — total GPU utilisation
And done! Congratulations on completing this article!
Takeaways
A monitoring component is an essential MLOps practice to enhance the management and optimization of ML models in production setups. In this article, we’ve built a Prometheus & Grafana monitoring service for a Triton Inference Server deployment, monitoring complex metrics related to GPU usage, latency, throughput, and CPU-GPU exchange times.
The setup is ready for production, however, we could add more features such as:
Alerts - for critical metrics, to catch issues before they impact users. These can be sent via email, slack, or other services.
Centralized Monitoring - add more services and separate dashboards by labels.
Data-driven decisions - we could inspect metrics history to spot peaks and lows and adapt our deployment settings based on extracted insights (e.g, scale down during 10PM - 8AM, or scale up during the day).
Thank you for reading, see you next week!


